Full-stack web app · live transit data
TransitPulse
A full-stack web app built on Edmonton's live transit data, with a live map, replay, reliability reports and route-change estimates.
- Role
- Solo full-stack project · AI-assisted
- Timeline
- 2026
- Status
- Complete (feature freeze, September 2026)
- Platform
- Web app, runs locally (no hosted demo)
- Stack
- Python · FastAPI · PostgreSQL + PostGIS · SQLAlchemy · Alembic · Next.js · React · TypeScript · MapLibre GL
How it was built
I used TransitPulse to learn a full web stack I hadn’t worked with much before: FastAPI, PostgreSQL and PostGIS, Next.js and live GTFS data. I worked through it in long sessions with AI tools helping along the way, writing code with me and reviewing screenshots and test results against written pass/fail criteria. A handoff file kept track of where each session left off. I decided what the app should do, set those criteria, and checked the results.
Highlights
Four modes
Live, Replay, Analytics and Scenarios. Each mode answers one question, and measured values are always shown separately from estimates.
Recorded history can't be changed
PostgreSQL triggers block updates and deletes on the recorded observation tables, so Replay and Analytics always show what the feed actually reported.
Ranges and confidence levels
Estimates come with a range and a confidence level. If a route has too little recorded data, Analytics doesn't show its reliability figures.
202 backend tests in CI
Some tests empty tables while they run, so the test suite refuses to connect to any database that isn't named as a test database.
What it does
TransitPulse is a real-time transit analytics app built around Edmonton Transit Service data. Every 30 seconds it records where vehicles are and how late their trips are running, and it keeps that history so the same data can be used for live monitoring and for looking back at past service.
The app has four modes, and each one answers a different question:
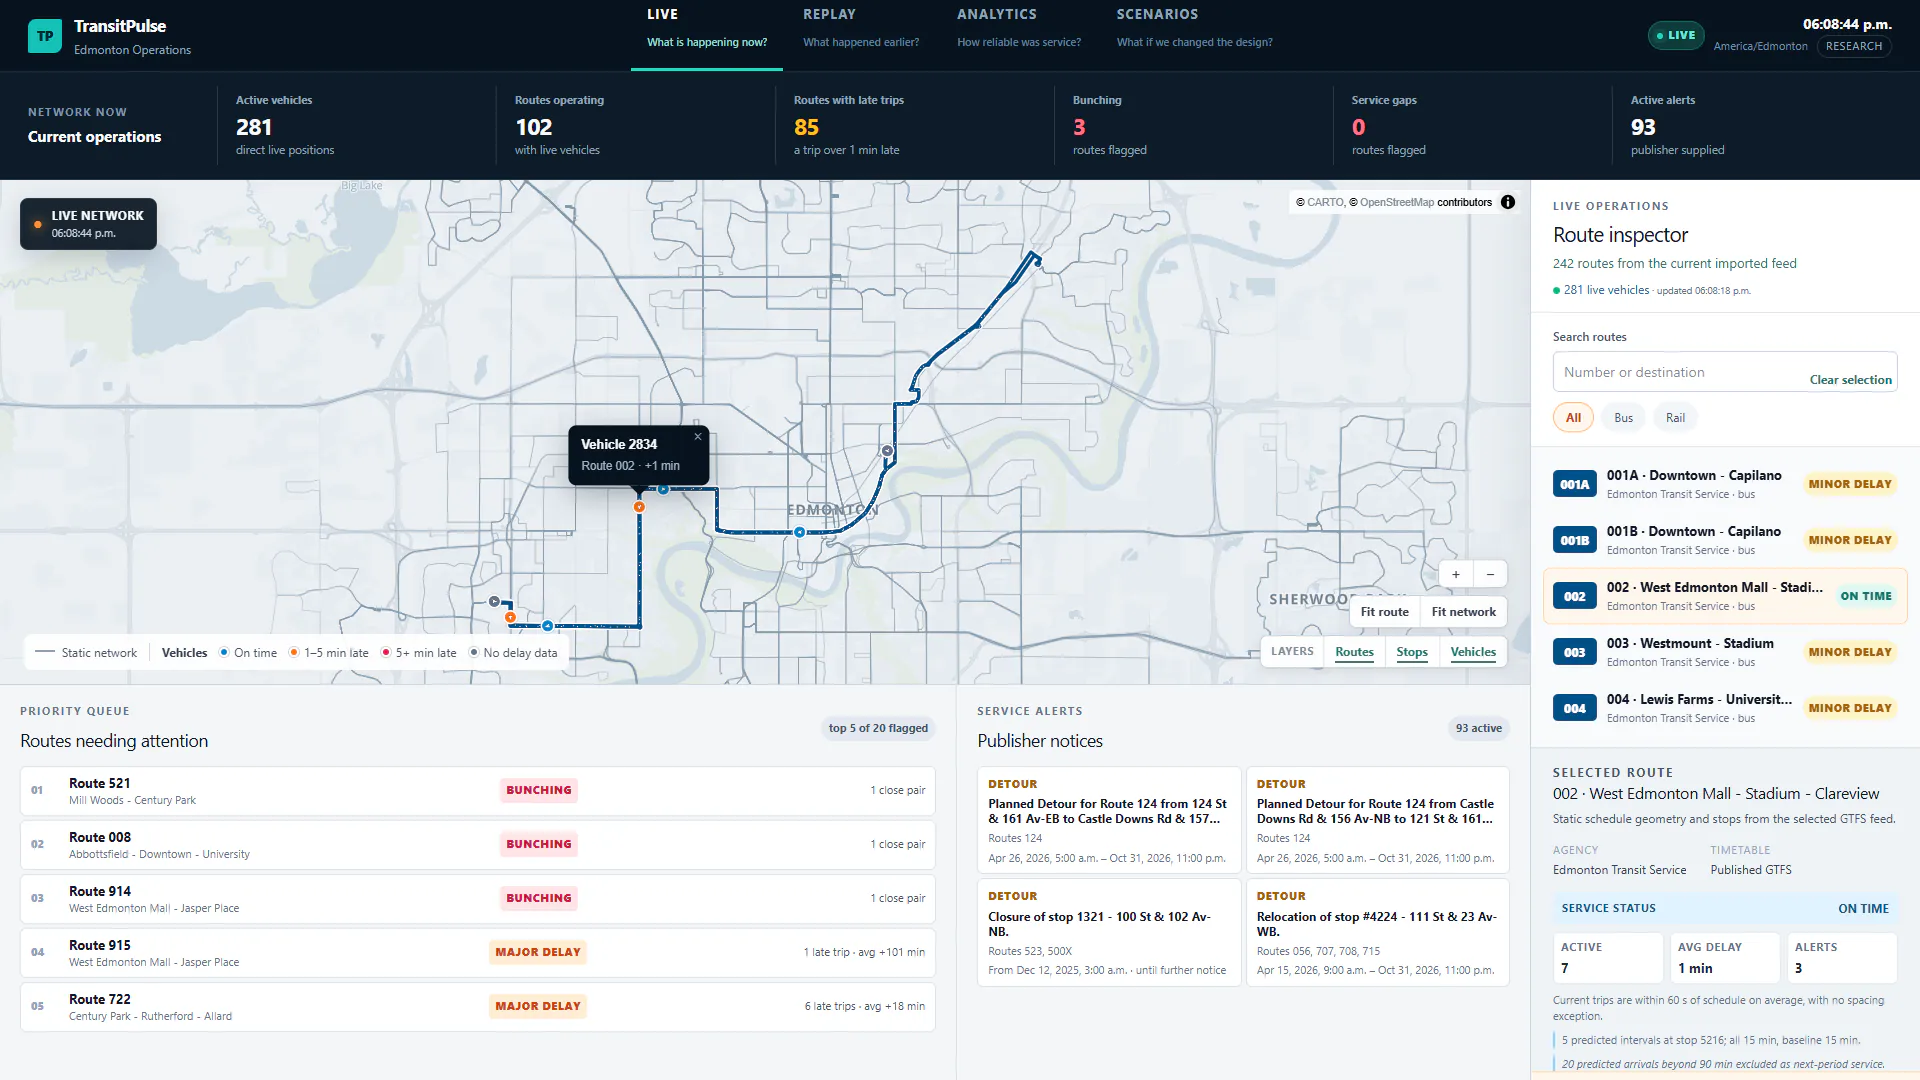
- Live shows what is happening now. Active vehicles are shown on a map, coloured by how early or late they are, and delayed routes are highlighted.
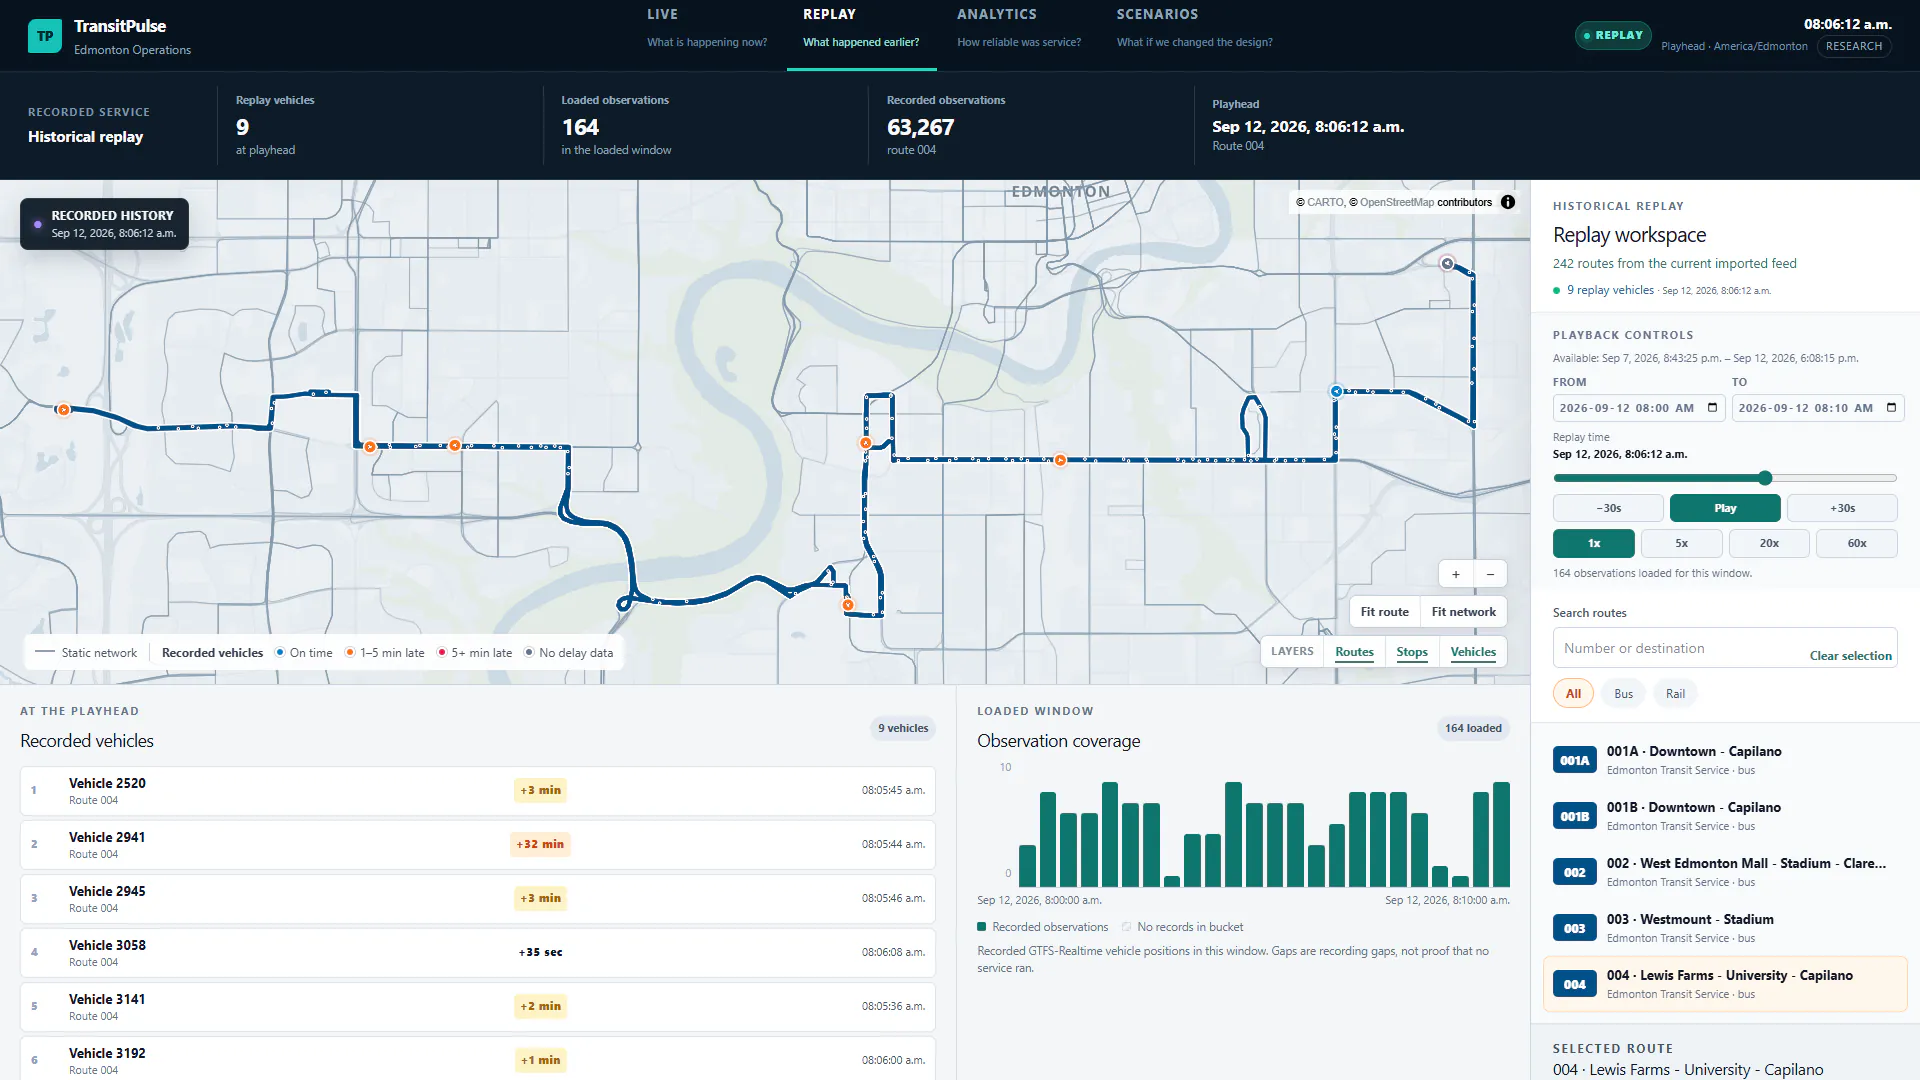
- Replay shows what happened earlier. You can play back vehicle movements from an earlier time, and any gaps where the live feed was down are shown instead of being filled in.
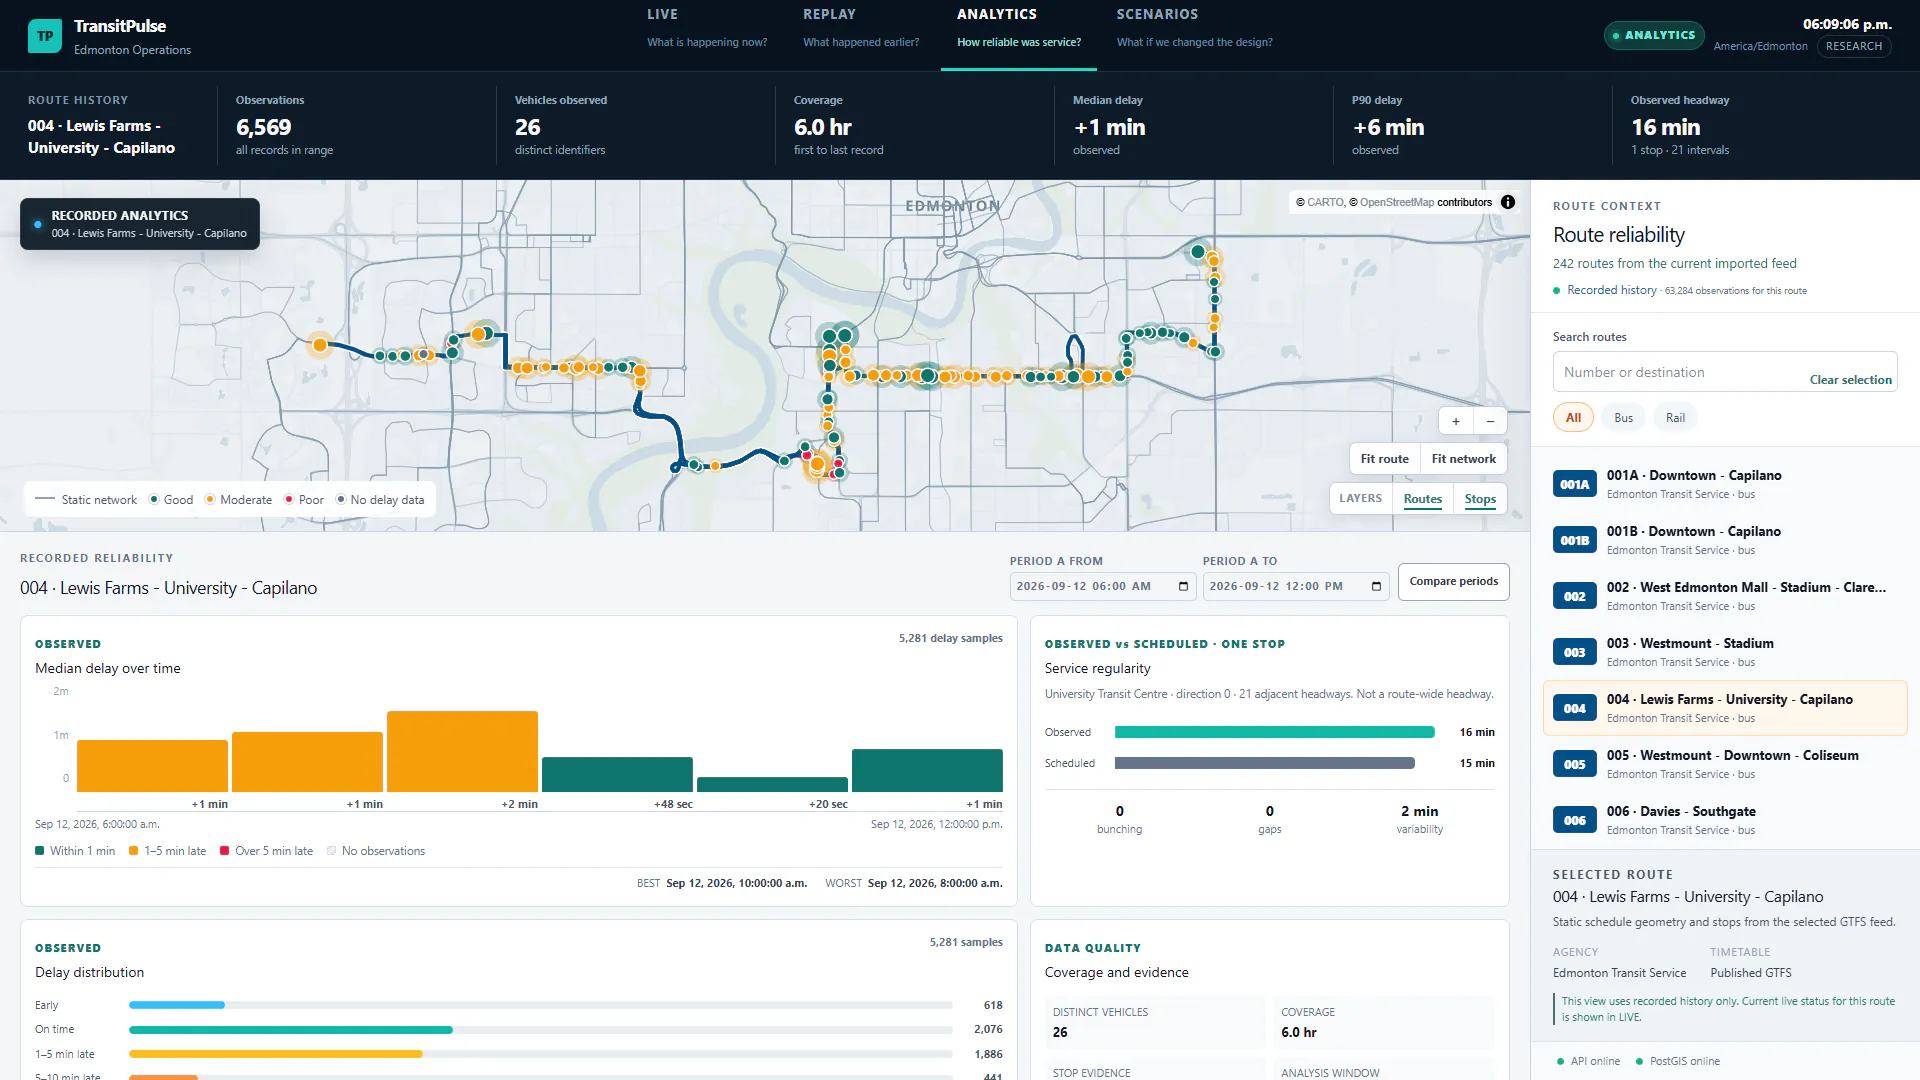
- Analytics shows how reliable a route was, by comparing actual delays and the spacing between buses with the published schedule.
- Scenarios estimates what would happen if a route changed, like making it shorter, removing stops or running it more often, and how that would affect travel time and the number of vehicles needed.
A lot of the work went into dealing with real transit data. Live feeds drop out, send the same update more than once, or disagree with the published timetable. TransitPulse keeps track of those problems instead of hiding them, and shows how reliable each estimate is.
What’s in it
- A recorder that pulls Edmonton’s GTFS-Realtime feeds every 30 seconds. Between September 7 and 13, 2026, it recorded 1,821,960 vehicle observations.
- A GTFS timetable importer that checks the required files, columns and stop rules before writing anything, and rolls everything back if something fails.
- A FastAPI backend on PostgreSQL and PostGIS, with SQLAlchemy models and seven Alembic migrations. It serves the live map, replay, analytics and scenario estimates. Requests have limits, like a 24-hour history window and caps on result sizes, and bad input gets a clear error.
- A Next.js, React and TypeScript front end with a MapLibre map, vehicles coloured by delay, historical playback and reliability charts.
- A dataset of 5,940 route records built from the published timetables of eight North American transit agencies, used to train and test the route-change model.
- A route-change estimator that gives a range and a confidence level instead of a single number.
- 202 backend test cases, which GitHub Actions runs against a real PostGIS database after applying the migrations.
Problems and fixes
-
Live feeds often send the same update more than once. The recorder hashes each observation together with the timetable import it belongs to, and a unique constraint makes sure it’s only stored once. A test sends the same payload twice and checks that only one row is saved. Database triggers block any update or delete on the recorded tables, so Replay and Analytics keep showing what the feed actually reported. If a feed fails, its health is recorded and its last good state is kept instead of being cleared.
-
An early version showed a route that runs every 15 minutes as having a bus every 2.5 minutes. Two things were wrong: vehicles going in opposite directions through the same stop were being counted together, and small timing changes in repeated feed updates were being counted as extra arrivals. After grouping by stop and direction and dropping the repeats, the median spacing came out to 15 minutes and 2 seconds, against the published 15 minutes.
-
The model needed to work on cities it had never seen. Each model was trained on seven cities and tested on the eighth, and that was repeated so every city was held out once. The linear models did best: ridge and plain linear regression both averaged about 3.36 km/h of error, ahead of random forest (3.46), gradient boosting (3.47) and a neural network (3.99). The neural network did well on the cities it was trained on but badly on new ones, so it wasn’t used.
-
Across the full test set, the estimator is 18% better than assuming a route change has no effect. For small changes, which are closer to what a planner would actually make, it’s only 0.5 to 2.3% better, so the app marks those predictions as low confidence.
-
Rebuilding the Edmonton dataset from the same source data changed 280 of 842 rows. The cause was a tie-break that depended on the order of Python’s hashed strings. Ties are now broken using the stop ID, and a regression test checks that rule.
More screenshots
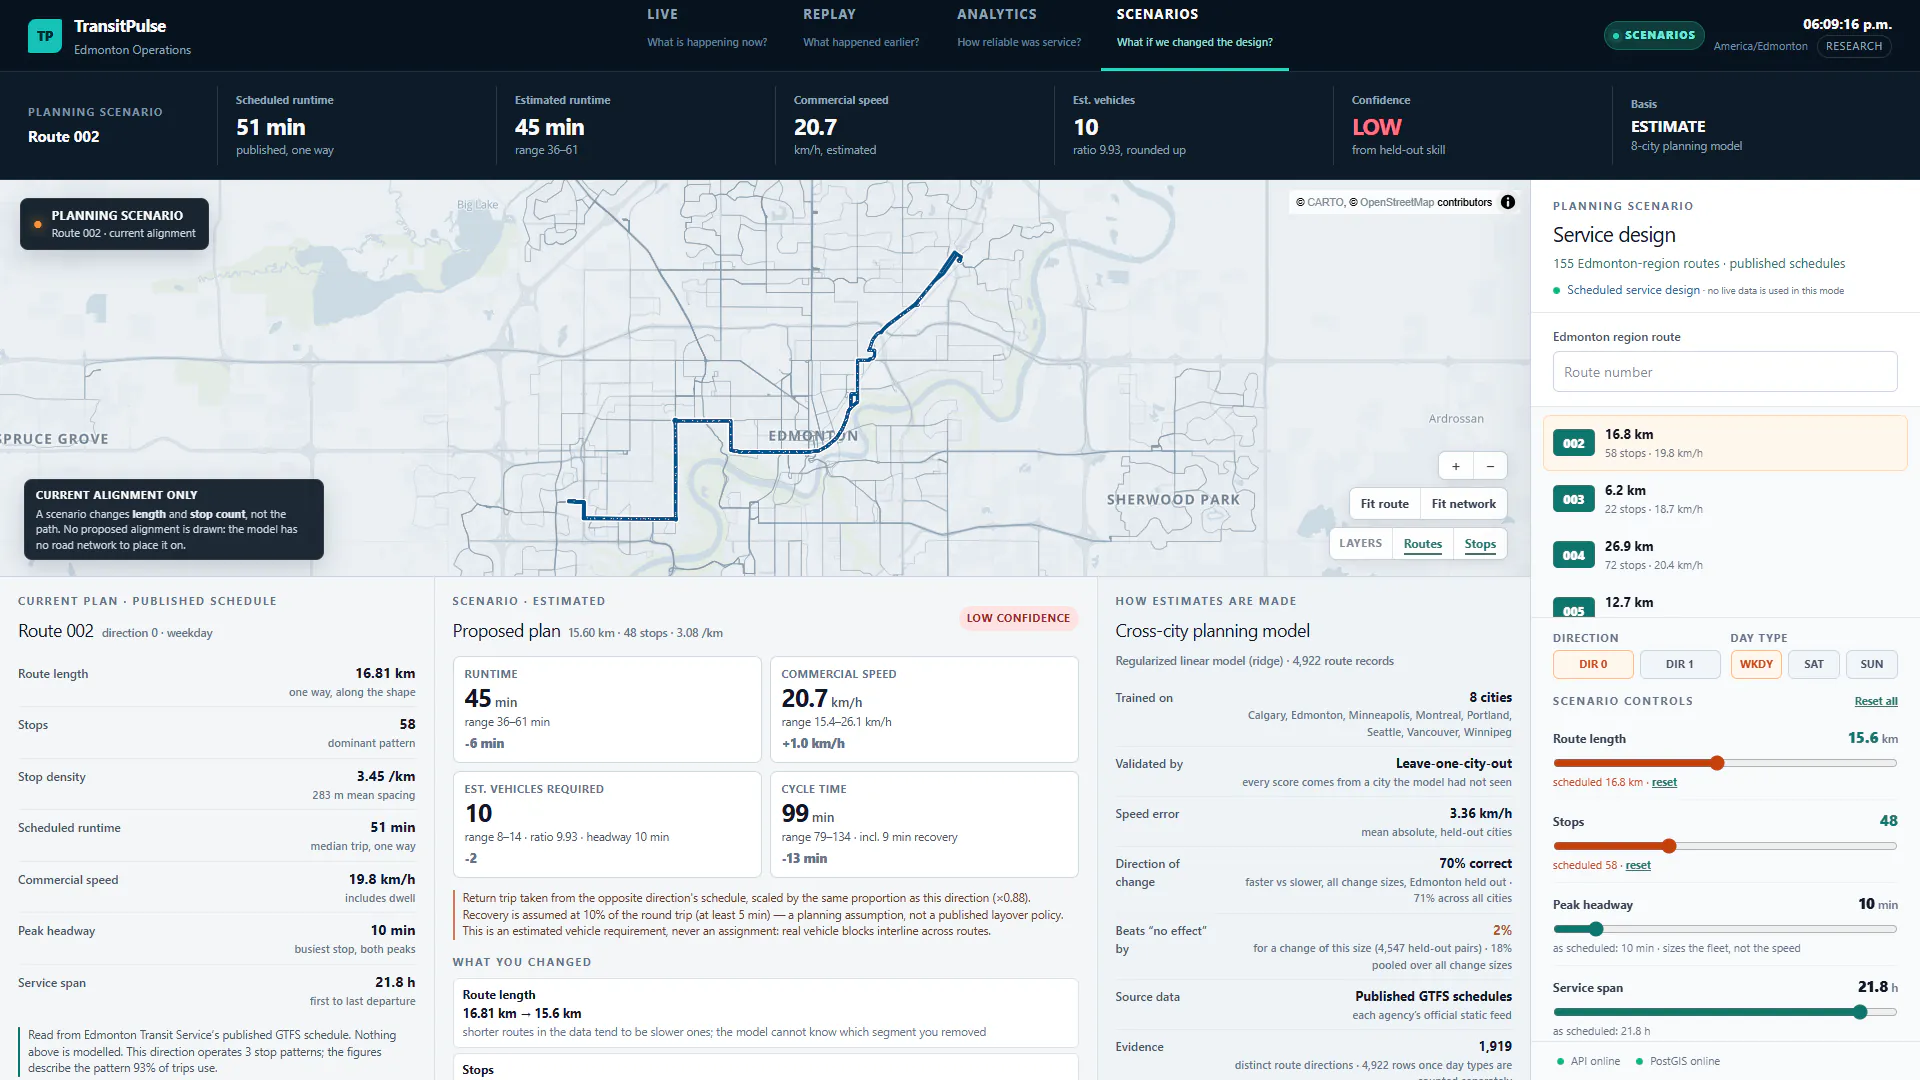
Scenarios mode with a shorter Route 002 and fewer stops, estimated as a range and marked low confidence. 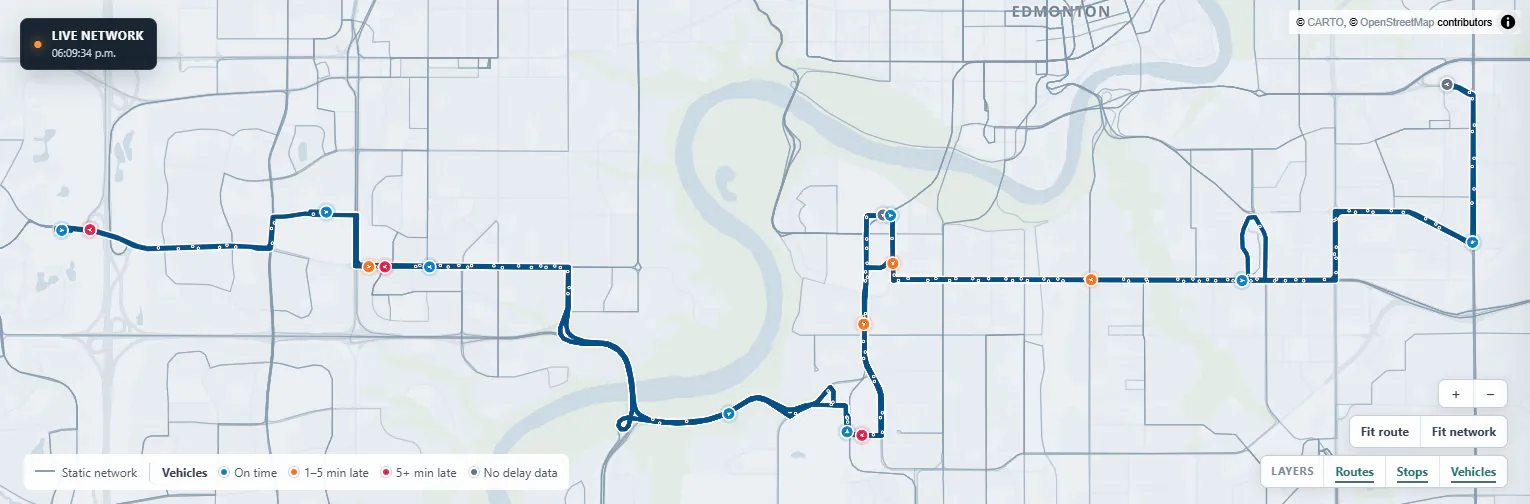
The custom map style, with the selected route highlighted and vehicles coloured by delay.
Technologies
- Python 3.13
- FastAPI
- SQLAlchemy 2 + GeoAlchemy2
- Alembic (7 migrations)
- PostgreSQL 17 + PostGIS
- psycopg 3
- Pydantic
- scikit-learn
- NumPy
- pytest
- Next.js 16
- React 19
- TypeScript
- MapLibre GL
- Tailwind CSS
- GitHub Actions
- GTFS & GTFS-Realtime
- AI coding agents
Links
- Source on GitHub for TransitPulse (opens in a new tab)github.com
- Project site for TransitPulse (opens in a new tab)usw344.github.io
TransitPulse runs locally with its own database and a connection to Edmonton Transit Service's live feed, so there isn't a hosted demo. The project site goes through each mode with screenshots from the running app, and the full source is on GitHub.
Transit data: Edmonton Transit Service open data. Map imagery in the screenshots: © CARTO, © OpenStreetMap contributors.